![]()
The Handbook was developed within the context of the Erasmus+ DALICO project as part of the Train the Trainer program outputs. The Handbook is intended to be used in relation with the DALICO Train the Trainer e-learning course. The course is methodology focused material providing tools and methods for trainers to organize a training program. The Handbook, on the other hand, aims at reviewing the principle content elements of a Data Literacy (DL), more specifically Research Data Management (RDM), course. While the Handbook gives input for trainers on WHAT to teach in RDM, the e-learning material helps to define HOW to do it.
The Handbook targets, broadly defined, all researchers and academic staff teaching data literacy aspects, and narrowly defined, the next generation researchers who want to raise awareness about research data management with their research community and in their classrooms.
Objectives
In order to foster data literacy, knowledge, skills and attitudes are required. This practical training program addresses a mixture of these categories. The DL competences connected to the context of RDM are selected.
Research data literacy can be defined as sub-discipline of data literacy that emerges from the need to educate students and scientists of all disciplines about data management issues.
Research data management is a method that enables the integration, curation and interoperability of data created during the scientific process including the production, access, verification, persistent storage and reuse of this data with the help of adequate and easy-to-use tools in virtual research infrastructures. Data are generated in all steps of a curation cycle that comprises the following steps: the conceptualization, creation or reception, appraisal, selection, ingestion, preservation, storage, access, use and reuse, and transformation of research data (Schneider, 2013).
The DALICO Training program consists mainly of two components: 1.) knowledge on research data management communicated, and 2.) the methods used to transfer this knowledge. Within the Train the trainers program knowledge is transferred to a limited number of paprticipants who act as multipliers in the process of knowledge transfer. The success of such programs depends on both the content of the training (Handbook content) and the methods used for training (E-learning course) since adult training (or andragogy) differs considerably from classical pedagogy.
The purpose of this Handbook is to:
- Outline a content structure for teaching Data Literacy.
- Provide guidelines, templates, good examples to support DL and RDM training.
- Advance common grounds to teach research data literacy skills.
- Increase learners’ engagement in training.
Target Audience
Researchers interact with infrastructures and research ecosystems to obtain, process, produce, deposit and share research data. As funders require more the visibility of research reusults and underlying data, standardized data management is becoming a demanded practice among researchers. The Handbook offers researchers an overview of the basic data competences that are necessary to successfully navigate the research data scene.
Sources
Schneider, R. (2013). Research Data Literacy. Proceedings of the 1st European Conference on Information Literacy (ECIL). Springer pp. 134-150.
Learning Objectives
- Identify key themes and data literacy core competencies.
- Understand the importance of data literacy education.
- Identify the main topics and skills for training.
- Be knowledgable about training methodologies.
What is Data Literacy?
Data Literacy is the ability to collect, manage, evaluate, and apply data; in a critical manner (Ridsdale et. al, 2015)
Data Literacy includes an understanding of the data sources and constructs, analytical methods and techniques applied, and the ability to describe the use case application and resulting business value or outcome.
Data Literacy also refers to research skill for students and professionals – accessing existing data sets to produce and communicate new knowledge, making scientific experiments robust and reproducible (Corrall, 2019).
In order for citizens to effectively engage and work with data, they must possess knowledge of the requisite theory and competencies. Data literacy shares the same theoretical grounding as information and statistical literacies.
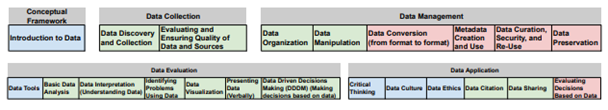
Key components and competences
Data Literacy competencies (22 in total) and their skills, knowledge are organized by the definition components of data, collect, manage, evaluate, and apply. They are categorized as conceptual competencies, core competencies, and advanced competencies. (Ridsdale et. al, 2015)
Teaching Data Literacy
Data literacy is an increasingly necessary skill, required in a variety of wider communities, academia, and industries. We live in a data-intensive era, the capacity to store massive amounts of data and forward them on high bandwidth networks increased interest in research data in all scientific fields. The recognition of this fact motivated varied researchers, universities and different funding bodies to make efforts to encourage the openness of research data. This drive toward openness is guided among others by the principle that scholarly research does not need more data, but requires having the right data (Borgman in Koltay, 2020). Researchers require high quality, actively curated data to work with: data has become both the raw material and the output of research.
Teaching data literacy in a research setting involves three main aspects :
- Research Data: Research data can be seen not just as the result of empirical work or the raw material for analysis, but also as a research object in its own right (Golub & Hansson, 2017). Data also may be regarded as anything recordable in a semantically and pragmatically sound way (Frické, 2008), as well as a primary intellectual asset that can be subjected to peer review and other forms of quality assessment (Heidorn, 2011). (Cited in Koltay, 2020). Students should be able to identify the relevant data for their research.
- Data Skills: When teaching data literacy skills to students, the overall learning outcome should be becoming data literate in the context of their subject area. Besides finding relevant data for their field of study, students should understand how data is connected to the publication process. Applying critical thinking strategies to data and understanding the challenges of reusing data, as well as awareness of the importance of metadata and citation are crucial in this process (Koltay, 2020). The ideal researcher is able to filter information based on importance and use a variety of tools and techniques. Doing this is unimaginable without sense-making, since there is no serious research without the ability to determine the deeper meaning of what is being expressed at face value. Data-based reasoning has to be coupled with the ability to translate large amounts of data into abstract concepts.
- Technological Skills: As research is becoming largely determined by computing, students should be knowledgable about the platforms and programs that enhance their research process and data management.
Teaching methodology and settings
Hands-on learning in workshops and labs provides students with the necessary practical experience needed to fully understand a technical skill; students need the chance to figure out processes and methods on their own and make mistakes to readjust their own understanding. Mechanics are very important in data literacy; practice is required.
Module-based learning allows students to achieve learning outcomes in stages, in a systematic way. Successive, or iterative, learning allows students to build upon previously learned skills, encouraging process over memorization. Beginning small and working up to the more complicated tasks allows students to have confidence in their abilities.
Project-based learning is a helpful way to implement the successive learning approach. Projects that include a wide range of investigation and have real-world applicability will solidify the connection between process/theory and practice. The project will allow evaluators the chance to assess skills practically, instead of formally. Projects should include real-world data, relevant to the students’ interests and in an engaging context, not just data for the sake of data. (Koltay, 2020)
Core skills
- Critical thinking and gaining knowledge from abstraction.
- application of results,
- analytical skills to use data,
- cognitive abilities to effectively work with data,
- computational thinking involves “defining abstractions, working with multiple layers of abstraction and understanding the relationships among the different layers” (Wing, 2008),
- adapting to new technology.
Sources
Corrall, S. (2019b). Repositioning Data Literacy as a Mission-Critical Competence. In: ACRL 2019: Recasting the Narrative, http://d-scholarship.pitt.edu/id/eprint/36975
Gläser, C. (2020). Wer spricht die Sprache der Daten? Data Literacy in der Lehre am Department Information. API Magazin, 1(2). https://doi.org/10.15460/apimagazin.2020.1.2.48
Guler, Gulsen. (2019). Data literacy from theory to reality: How does it look?. https://www.researchgate.net/publication/335620777_Data_literacy_from_theory_to_reality_How_does_it_look
Heredero, Manel, 2016: A Step-By-Step Guide to Building a Knowledge Map. [Online, Zugriff am: 2022-06-10] Verfügbar unter https://www.mindmeister.com/blog/build-knowledge-map/
Ridsdale, C. et al., 2015: Strategies and Best Practices for Data Literacy Education: Knowledge Synthe-sis Report. Dalhousie University, Canada. [online, Abruf: 2018-06-10] http://hdl.handle.net/10222/64578
Ridsdale, C., 2018: Strategies and Best Practices for Data Literacy Education. Presentation. [Online, Zugriff am: 2020-06-10] Verfügbar unter: https://www.stifterverband.org/download/file/fid/604
Schüller, K., Busch, P., Hindinger, C. (2019). Future Skills: Ein Framework für Data Literacy – Kompetenzrahmen und Forschungsbericht. Arbeitspapier Nr. 47. Berlin: Hochschulforum Digitalisierung. DOI: 10.5281/zenodo.3349865
Stewart McCafferty, A., & Beaudry, J. (2018). Mapping, visual literacy, and assessment for learning. In Teaching strategies that create assessment-literate learners (pp. 61-84). [Online, Zugriff am: 2022-06-10] Verfügbar unter: https://dx.doi.org/10.4135/9781506382135.n5
Wing, J. (2008). Computational thinking and thinking about computing. Phil. Trans. R. Soc. A 366: 3717–3725 doi:10.1098/rsta.2008.0118
Henderson, J. and Corry, M. (2021), “Data literacy training and use for educational professionals”, Journal of Research in Innovative Teaching & Learning, Vol. 14 No. 2, pp. 232-244. https://doi.org/10.1108/JRIT-11-2019-0074
Koltay T. (2020). Data literacy in academia: Basics and pedagogical view. Opus et Educatio 6 (4).
Learning objectives
- Familiar with FAIR principles;
- Aware of what data management and a data management plan (DMP) contain
- Familiar with the content elements that make up a DMP;
- Able to answer the DMP questions which are listed at the end of this chapter and adapt them to your own DMP.
What is RDM?
Research data management (RDM) refers to how you handle, organise, and structure your research data throughout the research process. Data management:
- Defining criteria for data collection;
- Includes measures for maintaining the integrity of the data;
- Providing detailed and structured documentation to be able to share your data with other colleagues and prepare them for longterm availability.
FAIR vs. Open Data
What is open research data?
Open research data is data that can be freely accessed, reused, remixed and redistributed, for academic research and teaching purposes and beyond. Ideally, open data have no restrictions on reuse or redistribution, and are appropriately licensed as such. In exceptional cases, e.g. to protect the identity of human subjects, special or limited restrictions of access are set. Openly sharing data exposes it to inspection, forming the basis for research verification and reproducibility, and opens up a pathway to wider collaboration. At most, open data may be subject to the requirement to attribute and sharealike (Open Data Handbook).
Open data becomes usable when made available in a common, machine-readable format. Open data must be licensed. The license should permit people to use the data in any way they want.
FAIR Data
While FAIR and Open data are overlapping but distinctive concepts, both focus on data sharing, ensuring that data are made available in ways that promote access and reuse (Higman et al. 2019). While Open Research promotes a cultural change towards sharing research outputs, FAIR concentrates on how to prepare data in a way that they can be reused by others. However, FAIR does not require data to be open and following FAIR can be beneficial for data that cannot be made open, due, for example, to privacy reasons. FAIR provides a set of rules that are a robust standard to which curation of data should aspire. Consequently, it should be noted that data that are FAIR compliant are not necessarily of high quality, and the issue of quality assurance of the data is a separate one, beyond the scope of this book. Similarly, it should be noted that FAIR-compliant data may be necessary but not sufficient in some reuse scenarios, e.g., computational reproducibility (see Peer et al. 2021).
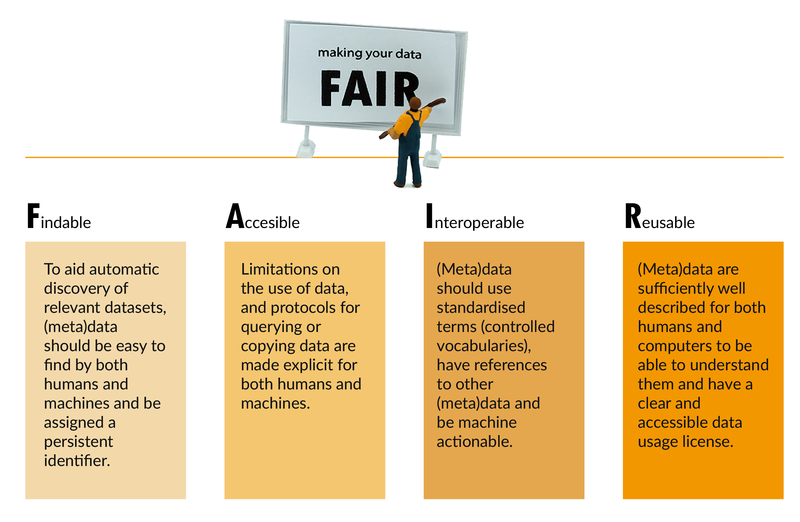
FAIR Principles
Source: https://dmeg.cessda.eu/Data-Management-Expert-Guide/1.-Plan/FAIR-data
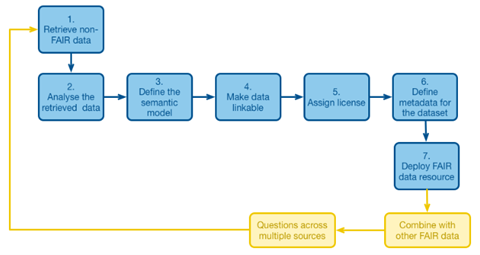
Making your data FAIR
The FAIRification Framework provides practical “how to” guidance on how to go FAIR and achive different levels of FAIRness with data. https://www.go-fair.org/fair-principles/fairification-process/
Findable
In order to increase discoverability of data: (1) data should be assigned a globally unique and persistent identifier, (2) data should be described with detailed metadata, (3) metadata and data should be easy to find for both humans and computers.
Accessible
When the required data are found, access to data should be managed, possibly including authentication and authorisation. The metadata are retrievable by their identifier, and the protocol can be made open and universally implementable.
Interoperable
The data usually need to be integrated with other data. In addition, the data need to interoperate with applications or workflows for analysis, storage, and processing. On a basic interoperability level, metadata use a formal, accessible and broadly applicabale language for knowledge representation. On a broader level, metadata use vocabularities that follow FAIR principles.
Reusable
The ultimate goal of FAIR is to optimise the reuse of data. To achieve this, metadata and data should be well-described so that they can be replicated and/or combined in different settings. On different levels of reusability, data use rich metadata with accurate and relevant attributes, or data are published with data usage license, furthermore data can meet domain relevant community standards.
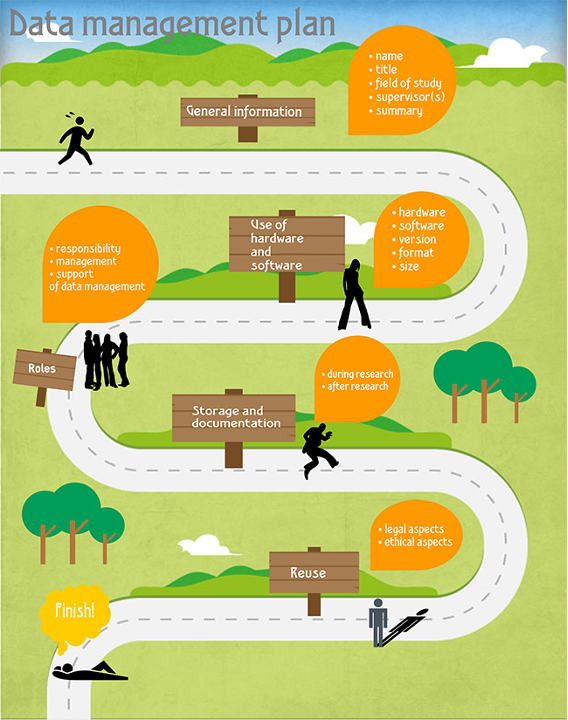
DMP
A data management plan is a formal document that outlines how to handle data collected or generated in the course of a research project and what happens to these data during its life-cycle. The goal of the data management plan is to ensure that data are properly collected, documented, made accessible, and preserved for future use. A data management plan is often a requirement of funding agencies.
A data management plan should address the questions:
- What data will be generated by the activity?
- What procedures will be used to manage the data?
- Which file format(s) will be used for the data?
- How will changes in the data files be tracked?
- Where will the data be stored?
- Who will have access to the data?
- How will the data be documented (metadata)?
- Will the data be available in a repository?
- What archive and long-term retention solutions are planned?
Source: https://libguides.ru.nl/datamanagementEN/dmp?fbclid=IwAR0Hll0XArVYN9JZjY1izj94E3gNlX9VNVPYcBMHCd52t3aKmYZNQwQRXlk
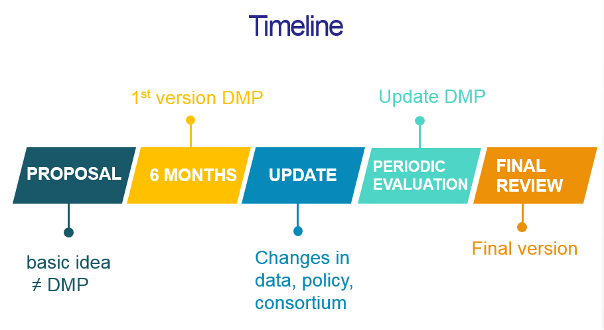
Data Management Plans are designed to be working documents and should be updated as the project proceeds or if there are any significant changes to the initial project plan.
https://www.openaire.eu/when-do-i-have-to-create-a-data-management-plan
Sample DMPs
- Digital Curation Centre (DCC) Example DMPs and Guidance: A summary of example plans organised by UK research funders is provided by the DCC. Some evaluation cribsheets, overseas examples and general guidelines are also referenced.
- DMPOnline Public DMPs: Public DMPs are plans created using the DMPonline service and shared publicly by their owners. They are not vetted for quality, completeness, or adherence to funder guidelines.
- LIBER Data Management Plan Catalogue: The Data Management Plan (DMP) Catalogue of the LIBER Research Data Management Working Group provides a central hub for DMPs from different disciplines together with quality reviews of the DMPs.
Core skills
- Preparing data sets: aware of data/metadata formats and standards, using persistent identifiers (PID)
- Making relationships between FAIR, open and RDM
- Able to develop DMP
- Aware of major principles of data security and data protection
- Know aspects of data interoperability
- Data management skills: database planning, data integrity, communication
Connection to ViaMint
The modul on Data Management in the ViaMint course can be connected to this chapter.
Training Examples
The following videos provide examples on how to incorporate content such as open and FAIR data, DMP creation into training. The case study videos showcase the implamentation of FAIR data and data management in practice.
Presentation: Adam Szaldobagyi introducing the concept of open data
Case study: Miklós Bán introducing his project in which open data plays a significant role
Presentation: FAIR Data
Presentation: DMP
Case Study: Peter Bay introduces his project
Sources
Data Management Expert Guide. CESSDA. https://dmeg.cessda.eu/Data-Management-Expert-Guide/1.-Plan/FAIR-data
FAIRification Process. GoFAIR. https://www.go-fair.org/fair-principles/fairification-process/
FAIRsFAIR. (2021). How to be FAIR with your data. https://zenodo.org/record/5787046#.Y013WexBy3I
Guidelines for a Data Management Plan. 2016. UNESCO.
Learning Objectives
- Understand the benefits of data sharing.
- Knowledgable about data publishing methods.
- Aware of the importance of copyright issues.
What is data sharing?
Data sharing is not a new thing, however, over the last decade progress in digital literacy and skills, technology, and the adaptation of legislative frameworks to the digital space have enabled data to be shared faster and at an unprecedented scale. The opportunities for information sharing have increased due to three aspects:
- increased availability and quality of data
- culture change in understanding the value of data,
- involvement of policymakers are committed to regulating data sharing.including empowering stakeholders to better exploit its opportunities.
Benefits of data sharing
Sharing data has a variety of benefits in different areas, and different stakeholders benefit from data sharing in different ways.
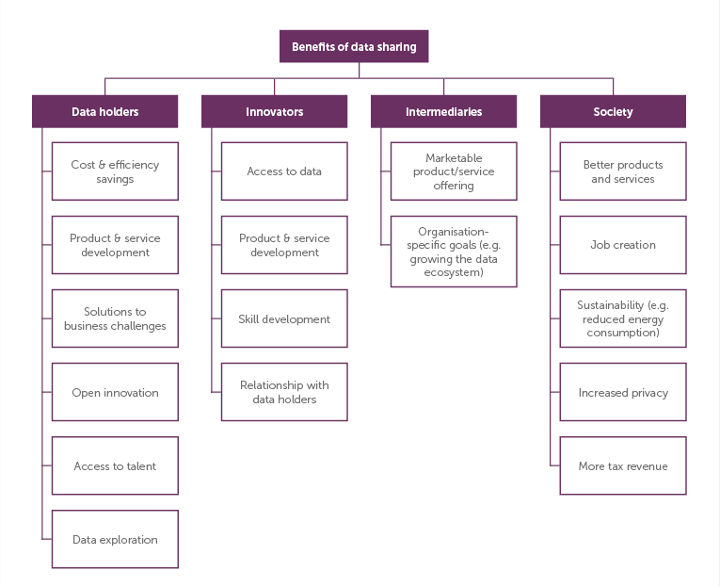
(datapitch)
Benefits in research
Transparency
Scholarly publications and scientific claims are the descriptions of a research work and its conclusions, but by themselves do not provide full disclosure on how the research has been done. A comprehensive research publication or claim should be accompanied with the underlying data and analysis used to formulate the results. This transparency of the research process, including sharing the data and analysis, allows us to understand and validate the conclusions.
Collaboration
It is not any longer the case that advance in science and knowledge is achieved in isolation by an individual or a sole scientific field. Collaboration is a critical piece of research progress, and increasingly includes multiple disciplines and skills. Sharing data openly allows researchers in fields outside yours to find your data and foster new collaborations across fields.
Research Acceleration
Making your data easily accessible enables other researchers to reuse and analyze the data from other perspectives, with the potential of offering new insights from the original work. As shown in the history of science where making data available from previous experiments or observations was essential to new discoveries, openness helps to accelerate the pace of science.
Reproducibility
Scientific truths must be verifiable and reproducible. However, some scientific fields are suffering from what it is now refer as a reproducibility crisis. Whether we are living a reproducibility crisis or we are simply now more aware than ever that reproducibility might get lost in the abundance of scientific publications in the 21st century, is up for analysis and discussion. But we can all agree that a critical step towards enabling and improving reproducibility is to share the data and analysis accompanying a claim.
Data Citation
As we have seen, sharing data openly is good for science and research. But it can also be good for you. When you share data in a public trusted repository (such as the Harvard Dataverse), you get automatically a formal data citation for your data set, with a persistent url (DOI) and proper attribution. As part of scholarly etiquette, when others use your data set, they cite it, and your number of data citations increase.
(ODAP, Harvard)
Publishing data
If you want to make your data (openly) available to the general public and make it FAIR (findable, accessible, interoperable, reusable), citable and comply with funder requirements, you can consider publishing it in a public data repository.
Data Repositories
A data repository is a storage space for researchers to deposit data sets associated with their research.
An open access data repository openly stores data in a way that allows immediate user access to anyone. There are no limitations to the repository access.
There are different kinds of data repositories, including:
- General-purpose repositories: accept a wide range of data types (and sometimes other research outputs as well) from all disciplines. Examples are:
- Zenodo
- Open Science Framework (single sign-on with Ghent University credentials possible)
- Dryad
- Domain-specific repositories: focus on specific data types or data from specific research domains.
- Institutional repositories: hold research data outputs from a particular research institution.
Whenever available, it is preferred to use domain-specific repositories as that increases the findability of the data by other researchers as well as facilitates the sharing of standardized data and metadata tailored to the scientific domain.
It is advised to share via a trusted or trustworthy data repository, if one is available for your research area.
Trusted data repositories meet the following characteristics:
- Provide broad, unbiased and ideally open access to the repository’s content, respecting legal and ethical limitations.
- Assign persistent identifiers to the content for referencing and citing.
- Manage metadata to enable discovery, reuse and citation and provide information about provenance and licensing. Metadata are machine-actionable and standardized.
- Ensure preservation of the repository’s content, also in the long term.
- Offer expert curation, guidance and/or quality assurance services for accuracy and integrity of datasets and metadata.
- Provide explicit information about policies.
- Run services, mechanisms and/or provisions to secure the integrity and authenticity of the repository’s content and to prevent unauthorized access and release of content.
According to the EC’s Horizon Europe Annotated Model Grant Agreement, trustworthy repositories belong to one of the below categories:
- They have received certification (e.g. Core Trust Seal, or ISO16363 ).
- They are domain-specific repositories that are internationally recognized, commonly used and endorsed by the scientific community.
- They are general-purpose repositories or institutional repositories that present the essential characteristics of trusted repositories (as summarized above).
It is beneficial for authors to select a data repository that issues a persistent identifier, preferably a Digital Object Identifier (DOI), and has established a robust preservation plan to ensure the data is preserved in perpetuity.
Data Journals
Data journals are publications whose primary purpose is to expose data sets. They enable you as an author to focus on the data itself, rather than producing an extensive analysis of the data which occurs in the traditional journal model. Typically, a publication in a data journal consists of an abstract, introduction, data description with methods and materials, short conclusion on reuse opportunities.
Fundamentally, data journals seek to:
- promote scientific accreditation and reuse;
- improve transparency of scientific methods and results;
- support good data management practices;
- provide an accessible and permanent route to the dataset.
Publishing a data paper may be regarded as best practice in data management as it:
- includes an element of peer review of the dataset;
- maximises opportunities for reuse of the dataset;
- provides academic accreditation for data scientists as well as for front-line researchers.
Publishing process
The six steps to make data available in a public repository include deciding on authorship of the dataset, exporting the data in plain text format using simple table formats, writing the metadata, depositing the data and metadata in a data repository, writing a data availability statement, citing the dataset in the methods section, and providing a citation in the literature cited section. By following these steps, authors will be ready to submit their manuscript to most journals that strongly recommend or require that they share their data at the time of submission or the resubmission stage. At the same time, authors will be following best practices for managing their data and for robust, reproducible science.
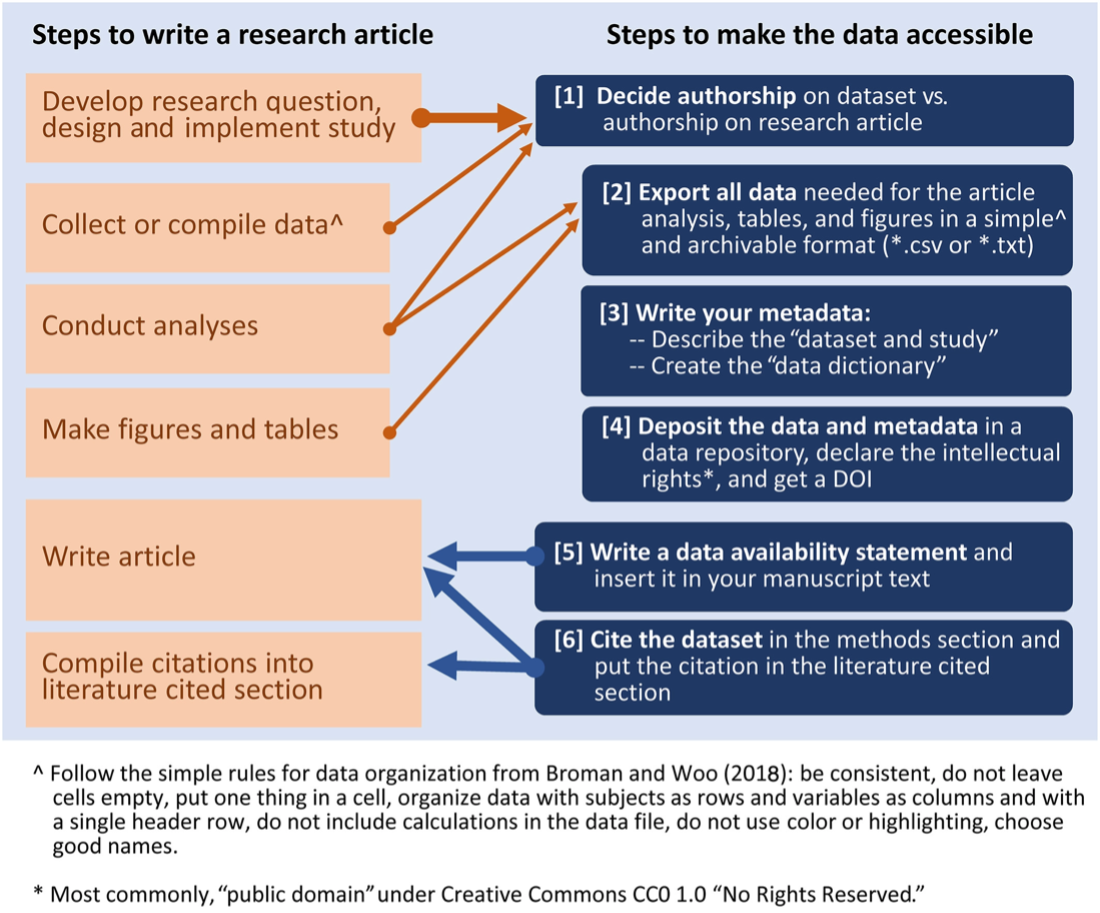
(Sorano, 2019)
Copyright
Copyright law does not protect ideas that are not expressed in an original form and does not protect data as such, principles, facts, etc.
Copyright is automatic, there’s no need to register, deposit, apply a © symbol, etc., although all these activities are permitted and may be even helpful. However, they cannot be a required for the copyright protection.
In the EU the default regulation for the copyright protection is 70 years after the author’s death. Related rights (e.g. sound recording, film fixations, non-original photographs, etc.) all have different protection periods, which are more or less harmonized in the EU.
The EU provides legal protection for data under the Database Directive. This act defines what a database is and gives the measures for which databases are treated under copyright (“by reason of the selection or arrangement of their contents, constitute the author’s own intellectual creation”) and under sui generis database rights when not under copyright. This is the case when the contents of a database are selected by an objective criteria, instead of through originality or creativity. In Europe, database rights protect the time and effort invested in obtaining, verifying and entering the contents into the database.
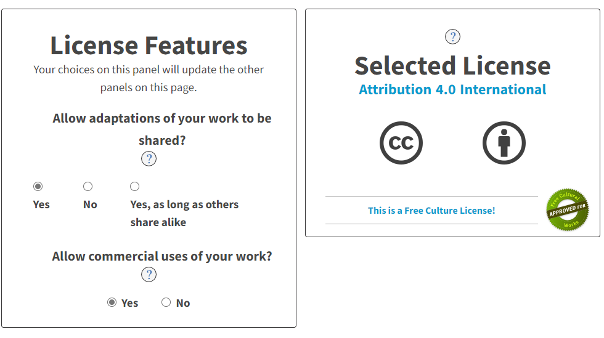
Creative Commons
Creative Commons is a nonprofit organization that helps overcome legal obstacles to the sharing of knowledge and creativity to address the world’s pressing challenges.
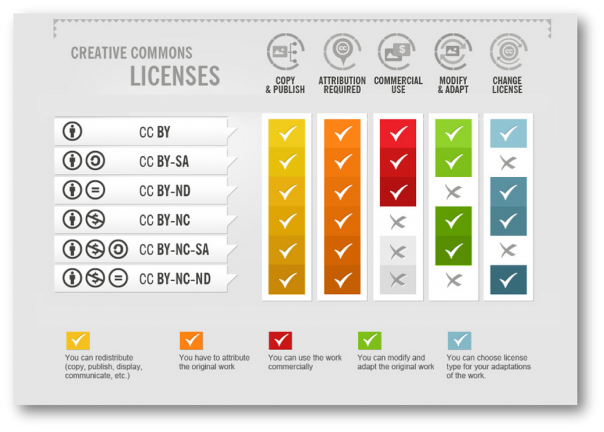
License selection
How to choose a license?
Choose a License (creativecommons.org)
In training
Presentations on data sharing:
Presentations on copyright issues:
Sources
The benefits of data shring. Data pitch. https://datapitch.eu/toolkit-benefits-of-data-sharing/
Benefits of data shairng. ODAP. Harvard University. https://projects.iq.harvard.edu/odap/benefits-sharing-data
Data publishing routes. Data Management Expert Guide. CESSDA. https://dmeg.cessda.eu/Data-Management-Expert-Guide/6.-Archive-Publish/Data-publishing-routes
Science Europe. (2018). Practical Guide to the International Alignment of Reserach Data Management. https://www.scienceeurope.org/media/jezkhnoo/se_rdm_practical_guide_final.pdf
Sorano, P. 2019. Six Simple Steps to Share Your Data When Publishing Research Articles. Bulletin 28 (2): 41-44. https://doi.org/10.1002/lob.10303
Whyte, A. (2015). Where to keep research data. DCC. https://www.dcc.ac.uk/sites/default/files/documents/publications/Where%20to%20keep%20research%20data.pdf.
CESSDA, Data publishing routes<6p>
Sorano, P. 2019. Six Simple Steps to Share Your Data When Publishing Research Articles. Bulletin 28 (2): 41-44. https://doi.org/10.1002/lob.10303
Learning objectives
- Knowledgable about managing sensitive data.
- Able to apply anonymization to a data set.
- Understand the connection to reproducible research.
When conducting academic research (regardless of the type of research or the stage you are at in your studies), it is important to have a grasp of basic research ethics and to make sure that your research is conducted appropriately and with integrity.
What is data ethics?
Data ethics is a branch of ethics that evaluates data practices: collecting, generating, analyzing and disseminating data, both structured and unstructured. It includes addressing and recommending concepts of right and wrong conduct, with transparency in and defensibility of actions in relation to data in general and personal data in particular.
Managing sensitive data
Sometimes research data involving people cannot be shared publicly due to the risk of violating privacy (see below). However, even highly sensitive information might be shared ethically and legally following these steps.
1. Ask for informed consent to share data
Study participants have a right to privacy that should not be infringed without informed consent. Participants should be let them know exactly how their data will be used and shared both in the short and long term. Data sharing should always be consistent with the terms of consent signed by participants.
Protect identities by fully anonymizing the data:
- Remove anything that identifies the subject: this might include names, addresses, workplaces, occupations, or salaries.
- Take out unnecessarily precise information: for example, you can replace subjects’ date of birth with their age.
- Generalize where you can: for example, replace subjects’ specific area of expertise with more general definitions
- Use pseudonyms
2. Control access to your data
It is still possible to deposit sensitive data in a repository but restrict access to it. This might mean that the files are private, but you can share access with others if certain requirements are met. You may also want to set different privacy settings for different components of your data. Some of the generalist repositories offering this type of functionality include Figshare, Zenodo, and OSF.
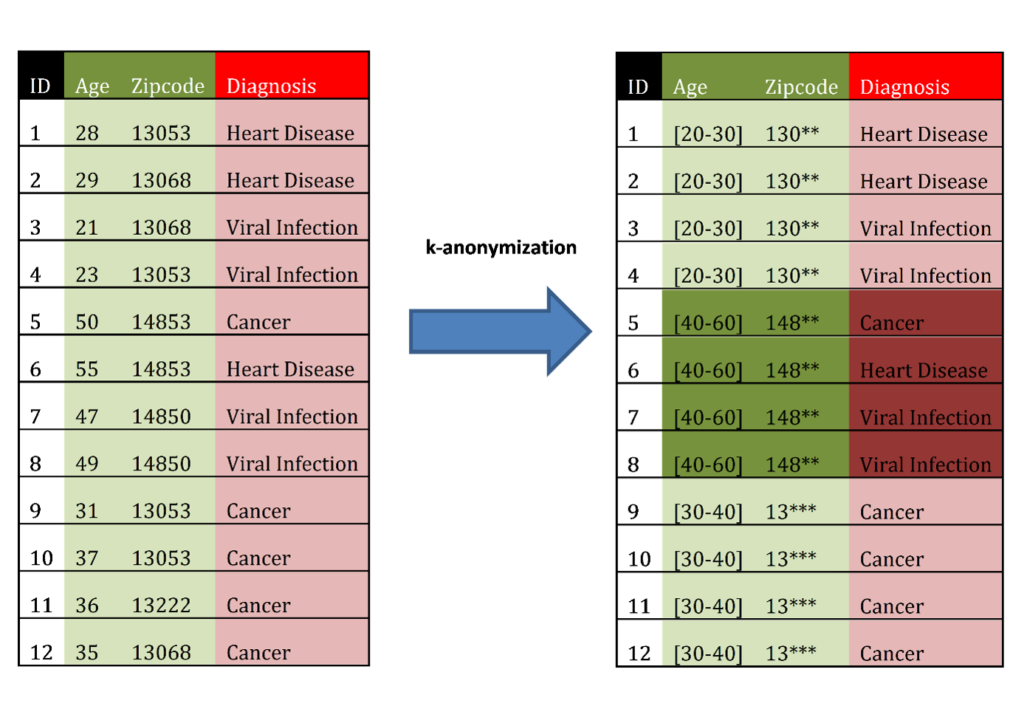
Anonymization: How can you de-identify your data?
Data anonymization is the process of irreversibly modifying personal data in such a way that subjects cannot be identified directly or indirectly by anyone, including the study team. If data are anonymized, no one can link data back to the subject.
Pseudonymization is a process where identifying-fields within data records are replaced by artificial identifiers called pseudonyms or pseudonymized IDs. Pseudonymization ensures no one can link data back to the subject, apart from nominated members of the study team who will be able to link pseudonyms to identifying records, such as name and address.
Data anonymization involves modifying a dataset so that it is impossible to identify a subject from their data. Pseudonymization involves replacing identifying data with artificial IDs, for example, replacing a healthcare record ID with an internal participant ID only known to a named clinician working in the study.
Training examples
The following video provides examples on how to incorporate content on data ethics and reproducible research into training.
Presentation: Christine Hoffman talks about responsible research and data ethics
Sources
The Turing Way Community, Becky Arnold, Louise Bowler, Sarah Gibson, Patricia Herterich, Rosie Higman, … Kirstie Whitaker. (2019, March 25). The Turing Way: A Handbook for Reproducible Data Science (Version v0.0.4). Zenodo. http://doi.org/10.5281/zenodo.3233986
Learning objectives
- Identify data visualization tools
- Knowledgable on the benefits and methods of visual data communication
What is data visualization?
Data visualization is a general way of talking about anything that converts data sources into a visual representation (like charts, graphs, maps, sometimes even just tables).
Scientific visualization: Generally, the visualization of scientific data that have close ties to real-world objects with spatial properties. An example might be visualizations of air flow over the wing of an airplane, or 3D volumes generated from MRI scans. The goal is often to generate an image of something for which we have spatial information and combine that with data that is perhaps less directly accessible, like temperate or pressure data. The different scientific fields often have very specific conventions for doing their own types of visualizations.
Information visualization: also a broad term, covering most statistical charts and graphs but also other visual/spatial metaphors that can be used to represent data sets that don’t have inherent spatial components.
Infographic: a specific sort of genre of visualizations. Infographics have become popular on the web as a way of combining various statistics and visualizations with a narrative and, sometimes, a polemic.
Visual analytics: the practice of using visualizations to analyze data. In some research, visualizations can support more formal statistical tests by allowing researchers to interact with the data points directly without aggregating or summarizing them. Even simple scatter plots, when the variables are chosen carefully, can show outliers, dense regions, bimodalities, etc. In fields where the data themselves are visual (e.g., medical fields), visual analytics may actually be the primary means of analyzing data. The process of analyzing data through visualization is itself studied by researchers in the visual analytics field. (https://guides.library.duke.edu/datavis)
Training example:
The DALICO Summer School included a presentation on data visualization tools: